

ResiQuant and our academic partners just published a paper in the International Journal of Disaster Risk Reduction analyzing three decades of seismic retrofit activity in the City of Los Angeles. The study documents how policy mandates, financial incentives, and neighborhood-level dynamics have shaped which buildings actually got retrofitted, with implications that extend from public seismic-resilience policy into property insurance underwriting.
Completed seismic retrofits cut expected direct losses by 68.6% for cripple-wall homes and 41.2% for soft-story woodframe buildings under a scenario M7.1 Puente Hills earthquake. For carriers and MGAs absorbing California catastrophe exposure as admitted markets retreat, the practical question has always been which buildings in our renewal book are actually retrofitted, and what is that worth? Until now, the answer has been ZIP-code rate factors that mask significant variation between individual buildings. New research replaces that approach with an actuarial signal anchored at the building. Retrofit status is no longer a binary disclosure on an ACORD form.
These numbers are not modeled assumptions. They are empirically anchored estimates from the study, which analyzed more than 29,000 retrofit permits issued between 1994 and 2025 across the City of Los Angeles, geocoded each to the building level, and linked permit status to expected loss reduction. Led by Prof. Henry Burton's research group at UCLA, the paper's co-authors include lead author Godfred Ababio, ResiQuant cofounders Francisco Galvis and Omar Issa, and Sahar Derakhshan of Cal Poly Pomona.
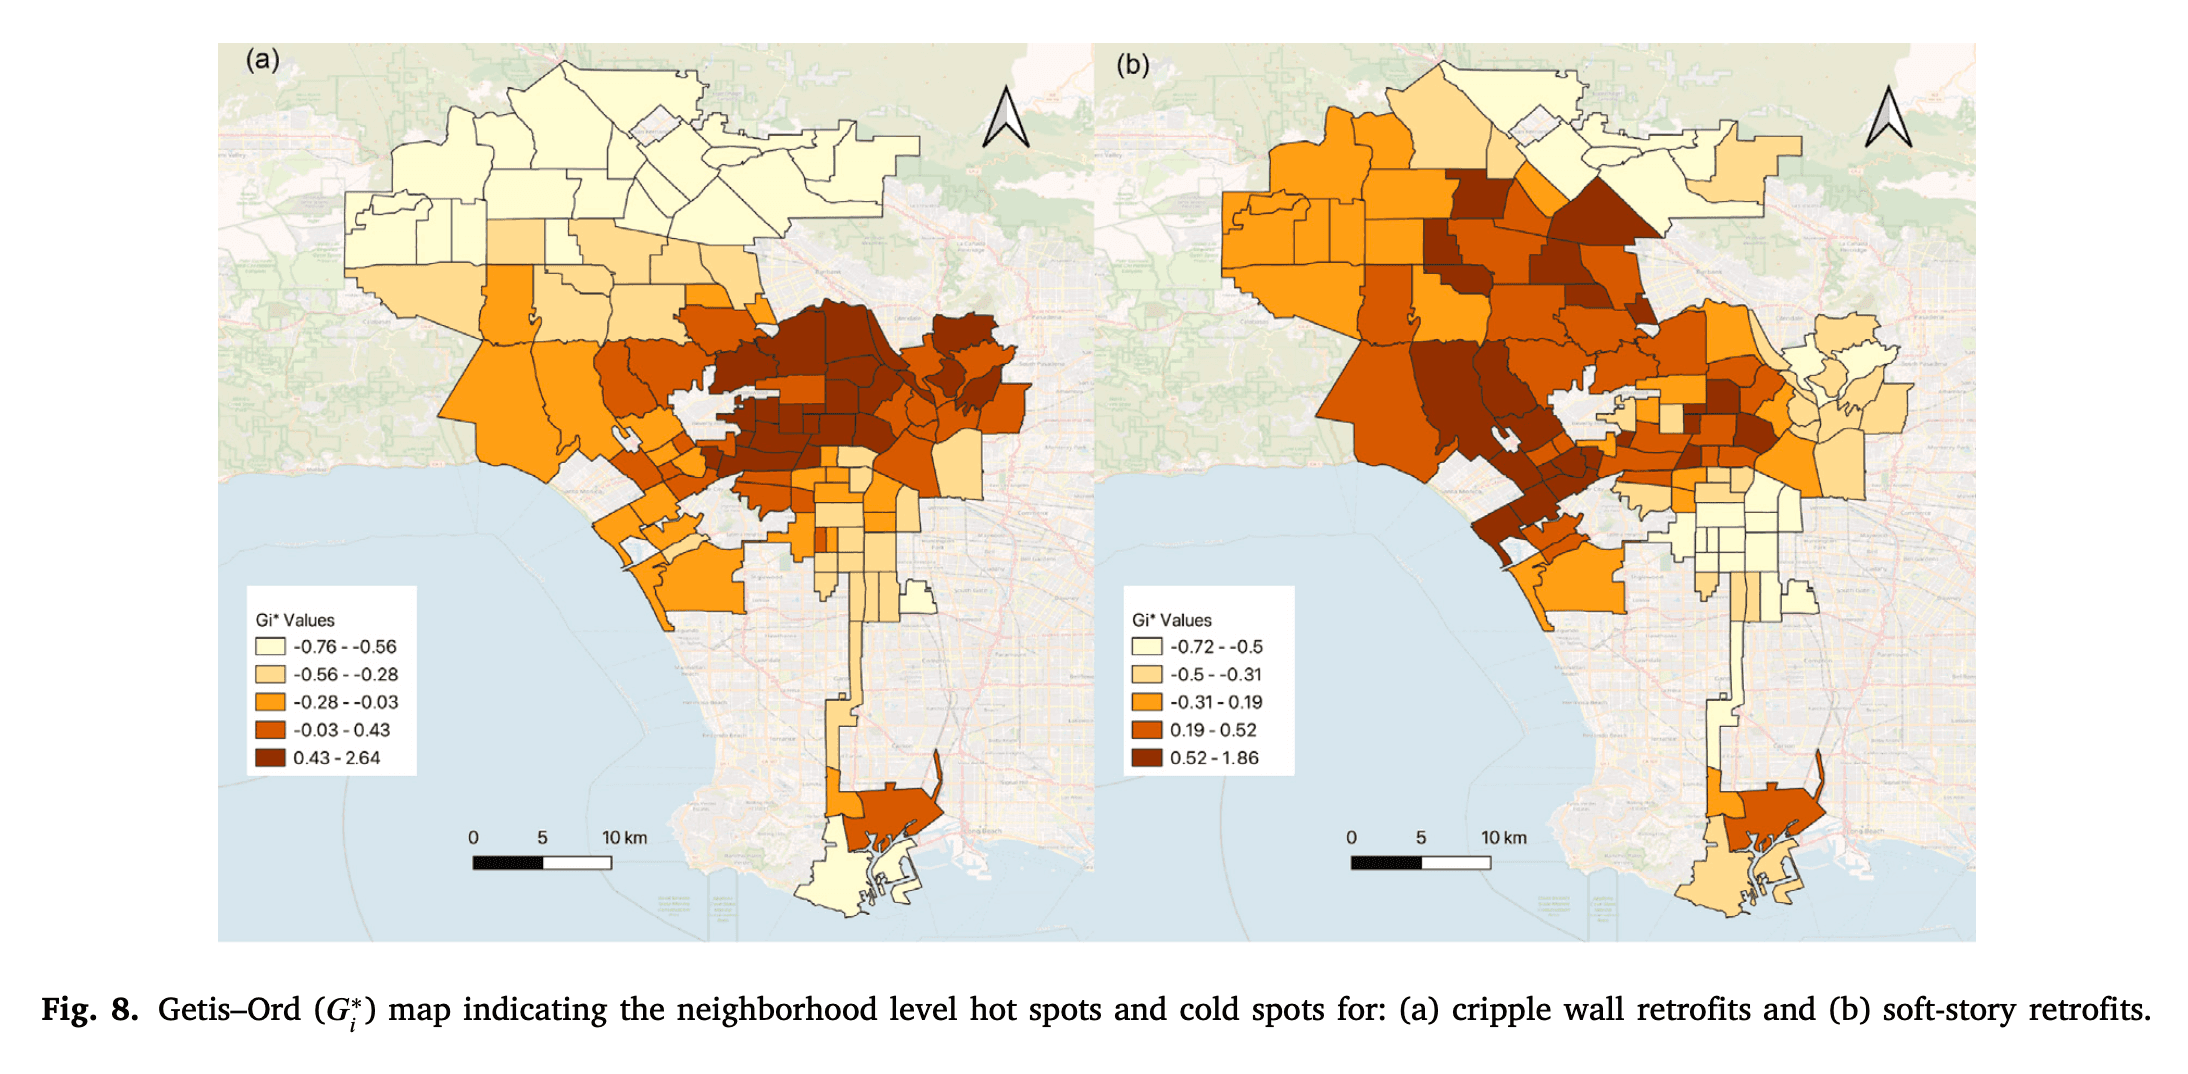
The signal also exposes a pricing problem. Correlation analysis in the paper shows retrofit hot spots diverge from the distribution of candidate buildings. ZIP-level aggregation systematically misprices individual risks in both directions, overcharging compliant buildings in low-retrofit tracts and undercharging non-compliant buildings in high-retrofit ones.
What the Permit Data Actually Shows
The paper organized its 29,000 permits across the five canonical California seismic vulnerabilities, ranging from cripple-wall single-family homes and soft-story (or "soft, weak, open-front") wood frame apartments to unreinforced masonry, non-ductile concrete, and pre-Northridge welded steel moment frames. The distribution of retrofit activity is heavily skewed.
Cripple-wall, 16,243 permits
Soft-story / SWOF, 12,568 permits
URM, non-ductile concrete, and steel moment frames, fewer than 500 permits combined
The thinness of the URM and non-ductile concrete numbers is not because those buildings are safe. URM was largely retrofitted under LA's 1981 Division 88 ordinance, the first mandatory URM program in the country, and that work was substantially complete before this dataset begins. Non-ductile concrete is the opposite problem. Under LA Ordinance 183893, owners have 25 years from an Order to Comply to finish a retrofit.
The completion runway extends into the late 2030s and early 2040s. For commercial-property portfolios with concrete-frame exposure in LA, that universe will likely remain unmitigated for the next 10 to 15 years.
How Policy Mechanics Drive Retrofit Rates
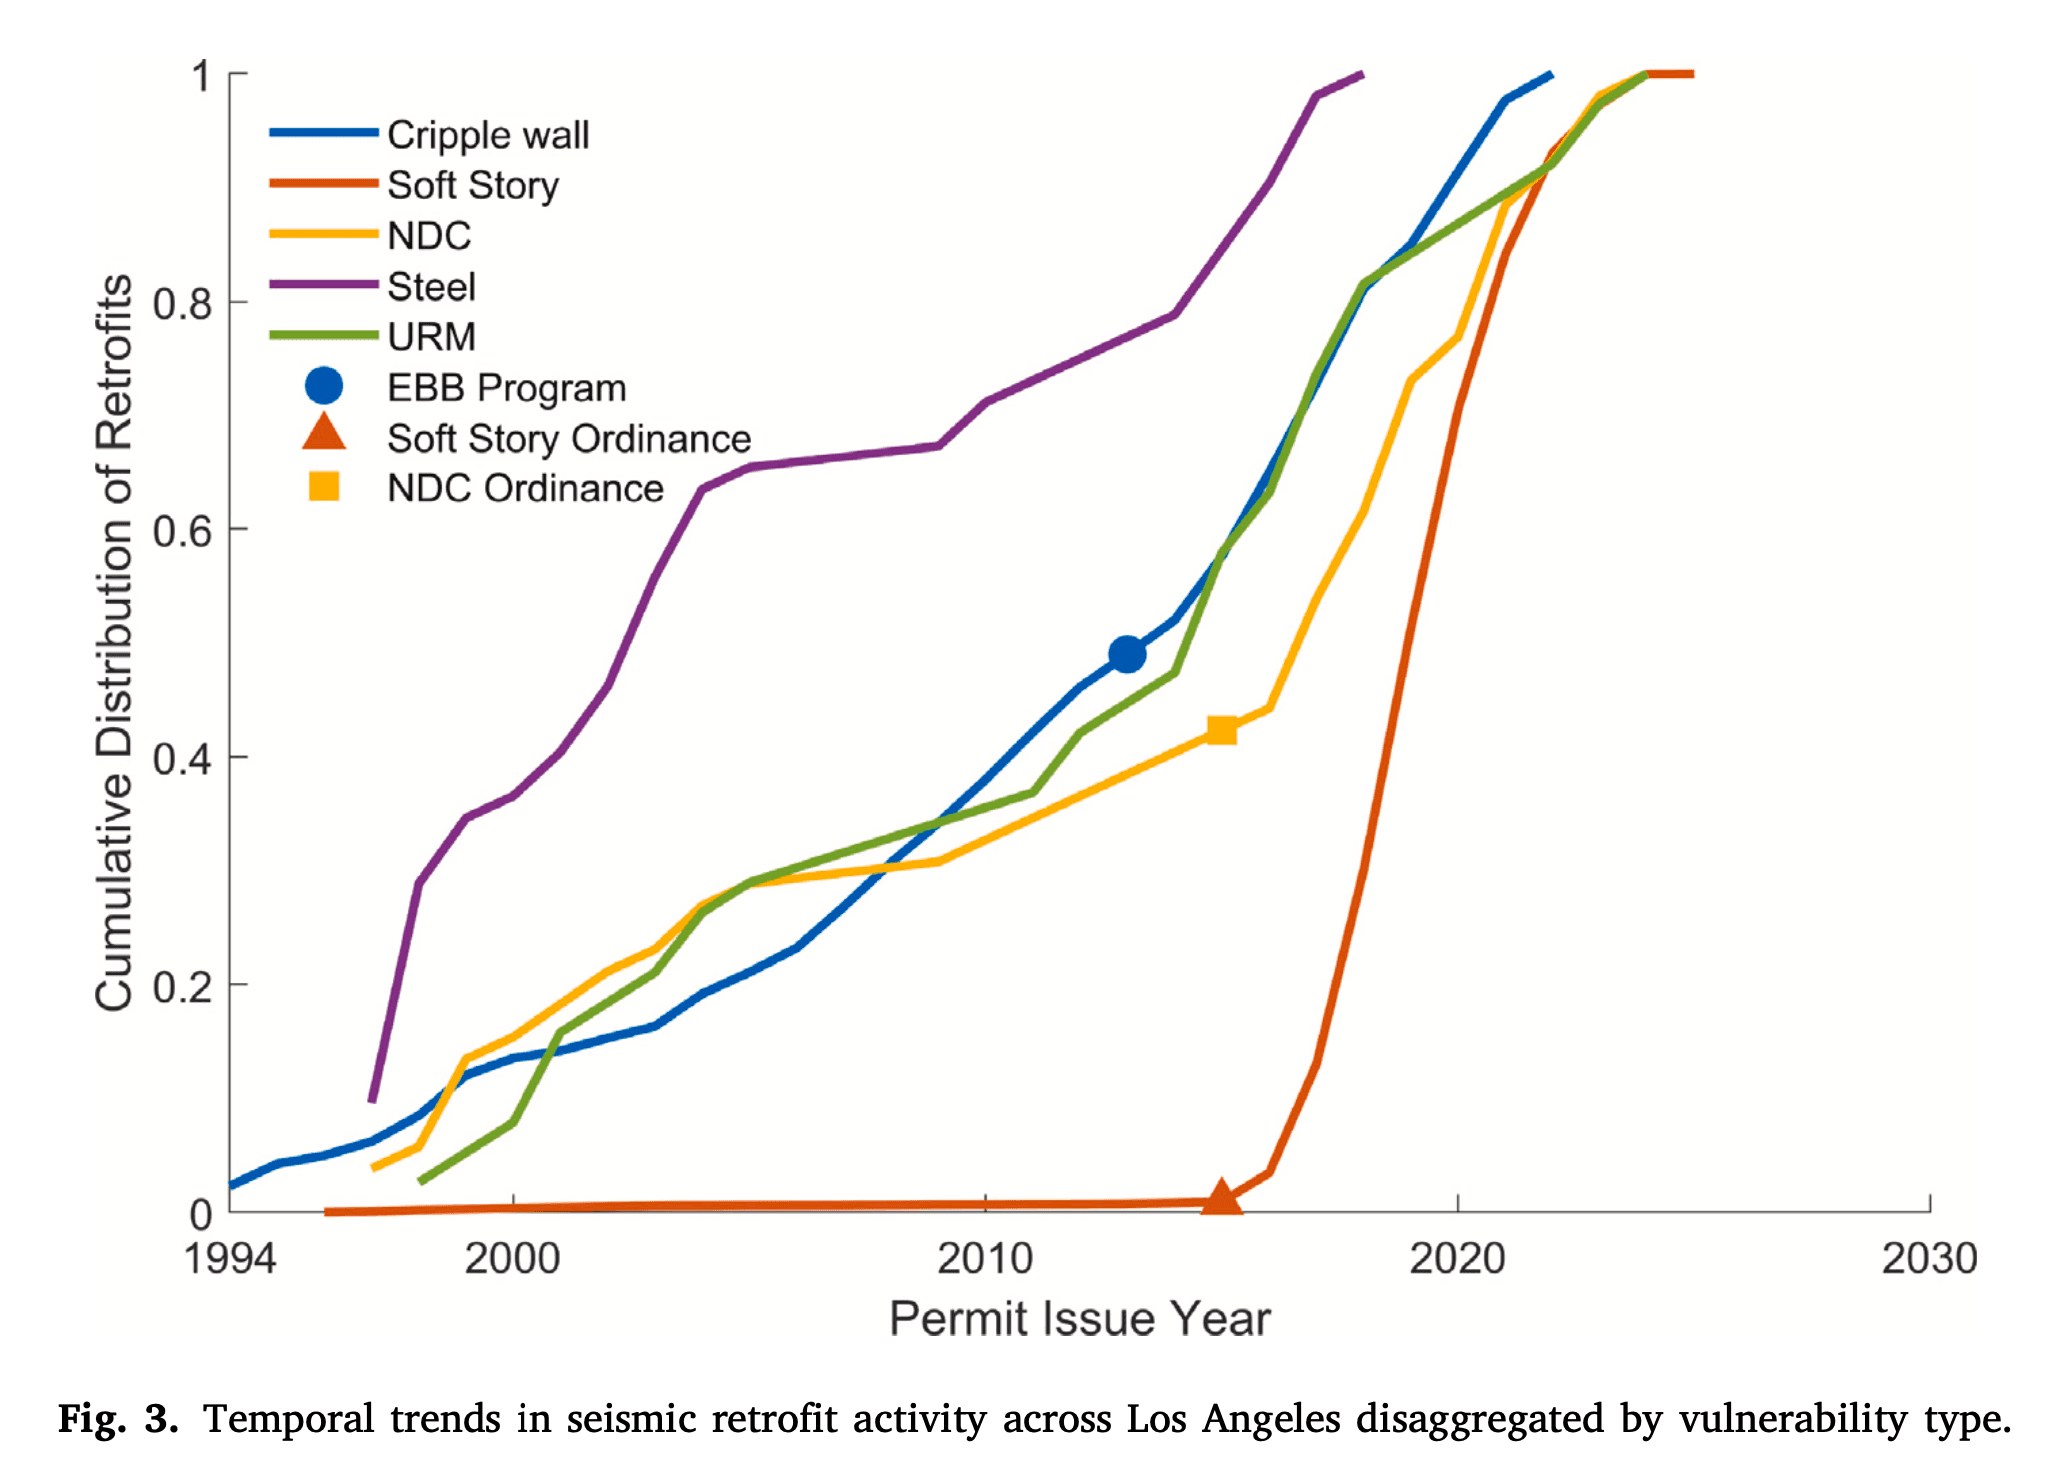
The time-series decomposition in the paper shows that different building types follow different retrofit patterns, and those patterns are driven by policy and subsidy mechanics, not by risk awareness.
Cripple-wall retrofits grew gradually over decades and held steady through the 2008 financial crisis and the pandemic. The driver is the Earthquake Brace + Bolt (EBB) program, a California Residential Mitigation Program subsidy of up to $3,000 per home, available in roughly 1,100 high-hazard ZIP codes. More than 32,500 California homes have been retrofitted under EBB since 2013, with the work executed against the prescriptive standard codified in California Existing Building Code Appendix Chapter A3.
The paper finds a positive and statistically significant association between social vulnerability and cripple-wall retrofit rates, indicating that EBB's ZIP-code targeting actively reached disadvantaged neighborhoods. That is unusual in mitigation programs.
Soft-story retrofits were nearly flat until 2015, then spiked sharply when LA's Soft-Story Retrofit Ordinance took effect. Roughly 68% of all permits in the 30-year dataset were issued between 2015 and 2025. The mandate covers pre-1978 wood-frame buildings with two or more stories and four or more units, with seven years from an Order to Comply to obtain a Certificate of Compliance.
But the work isn't done. Per LADBS' own February 2024 compliance reporting, citywide 7-year Certificate-of-Compliance completion sits at approximately 76%. Roughly one in four soft-story buildings subject to the order has not finished the work, despite the deadline window having passed for many. And the paper finds a negative and statistically significant association between social vulnerability and soft-story retrofit rates. The compliance gap is concentrated in the neighborhoods least able to fund the work.
The Puente Hills Scenario
The paper applied its loss-reduction analysis to a possible future scenario of a Mw7.1 earthquake on the Puente Hills blind-thrust fault, which runs beneath downtown Los Angeles. Unlike the 1994 Northridge rupture (San Fernando Valley) or the southern San Andreas (Inland Empire), Puente Hills places maximum shaking directly under the densest, oldest, most commercially valuable parts of LA.
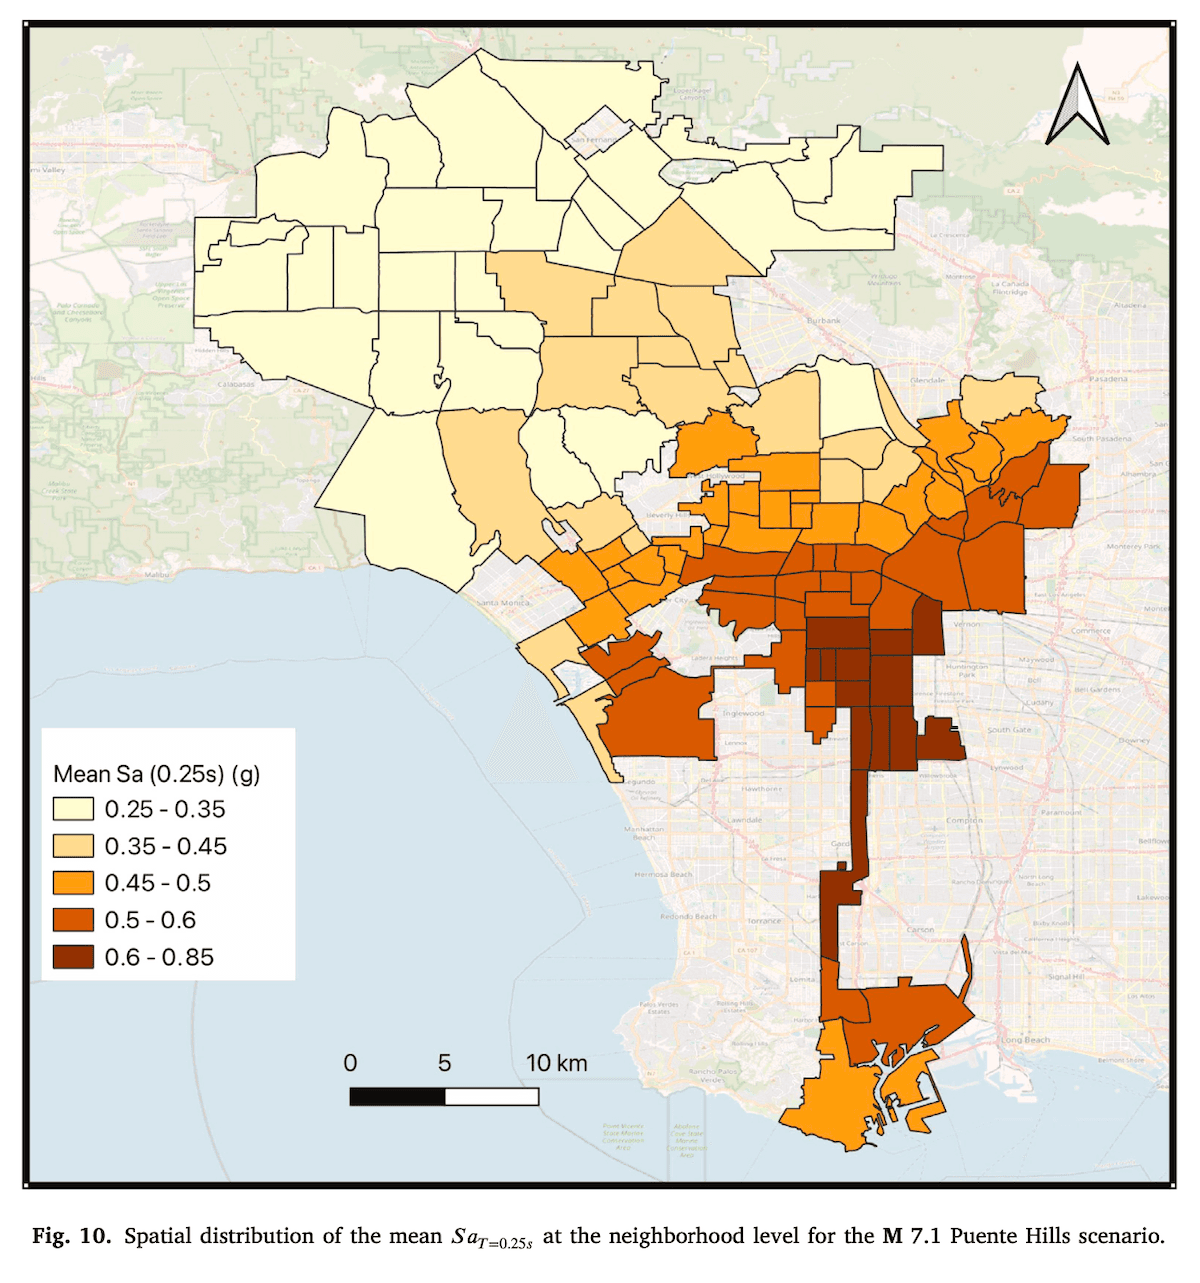
Against that scenario, the paper's findings are striking. For cripple-wall homes, retrofits cut expected direct losses from $1.9 billion to $593 million, leaving $1.3 billion in avoided losses, a 68.6% reduction. For soft-story buildings, losses drop from $10.6 billion to $6.2 billion, leaving $4.4 billion avoided, a 41.2% reduction. The cripple-wall percentage is higher, but the absolute dollar reduction is more than three times larger for soft-story, because those buildings are larger, denser, and more concentrated in commercially significant geographies.
The study also paired these benefits against representative retrofit costs to estimate benefit–cost ratios of roughly 15:1 for cripple-wall retrofits ($1.3 billion in avoided loss against approximately $88 million in retrofit spend) and 7:1 for soft-story retrofits ($4.4 billion against approximately $628 million). Both ratios sit well above the thresholds typically used to justify hazard-mitigation investment at the federal or state level.
The 68.6% and 41.2% figures sit close to the engineering basis of the California Earthquake Authority's Hazard Reduction Discount, which offers up to 25% premium reduction for verified retrofits on pre-1980 wood-frame homes. The CEA writes roughly 70% of California residential earthquake policies, so this is the dominant market signal rewarding retrofit work. Until now, the rate relativity behind that discount has rested on modeled assumptions. The dataset compiled for this study gives it empirical anchoring at the building level.
Three Implications for Insurance Carriers and MGAs
For property insurance carriers and MGAs writing California Earthquake, three implications follow from this research.
First, address-level retrofit status is now an actuarial variable, not a disclosure question. A pre-1978 soft-story building in Koreatown with a recorded Certificate of Compliance is a different risk than a structurally identical building three blocks away that filed plans in 2018 and hasn't pulled a final inspection. The current ACORD intake process collapses both into the same submission.
Second, compliance status varies by ordinance and by city. LA's soft-story program is mature but incomplete. The non-ductile concrete program is in early innings. URM is essentially closed. San Francisco, Berkeley, Oakland, Santa Monica, and roughly a dozen other California cities operate their own soft-story ordinances on different timelines. A "California portfolio" is really a patchwork of ordinance-status exposures that aggregate poorly.
Third, the social-vulnerability gradient creates both adverse-selection risk and growth opportunity. Previous studies reports that earthquake insurance take-up in California sits at roughly 12% of eligible homes, with take-up in the lowest-income quartile running half that of the highest. Socially vulnerable communities are both less likely to be retrofitted (for soft-story) and less likely to be insured. For carriers and MGAs with the data infrastructure to underwrite at building level, this is a stratification opportunity for finding compliant, retrofitted properties in tracts that ZIP-rate factors penalize and avoiding non-compliant exposures in tracts that ZIP-rate factors flatter.
What ResiQuant Builds From This
The kind of building-level retrofit signal this paper relies on, including permit records, structural typology, ordinance applicability, and compliance milestones, is exactly the layer ResiQuant's Engineering AI assembles for carriers and MGAs underwriting California catastrophe property. Our team co-authored this research because both the research and the product are trying to answer the same underwriting question. Which buildings have actually been mitigated, and by how much? The research answers it at the population level, while ResiQuant's Engineering AI answers it for a specific address, producing a building-level output an underwriter can price against.
For a renewal schedule with California exposure, that means knowing which addresses have a recorded soft-story Certificate of Compliance, which carry non-ductile concrete exposure with no compliance action on file, and what the expected loss reduction is for each retrofitted building under a Puente Hills scenario, expressed as a loss-reduction factor derived from the same empirical basis as the Ababio et al. findings. That is the difference between knowing you have California exposure in aggregate and knowing the retrofit status, structural type, and ordinance position of each building in the book.
Carriers and MGAs writing property catastrophe risk should be pricing retrofit status as a rating variable, the same way they price construction class. Whether the exposure is wind in the Gulf, wildfire in the West, flood in the Mid-Atlantic, or earthquake in California, retrofit status is a building-level signal that ZIP-level aggregation cannot capture. Carriers who build that into their pricing will write better-quality business across their book, while those who don't will continue to average across a distribution that the data shows is wide enough to matter.


