Modeled loss estimates move for two reasons. Either the building sits somewhere different than you thought, or the building is different than you thought.
Engineering AI works on both. It resolves an address to the correct structure on the correct parcel, which commercial geocoders sometimes get wrong. It also reads the building itself the way a structural engineer would.
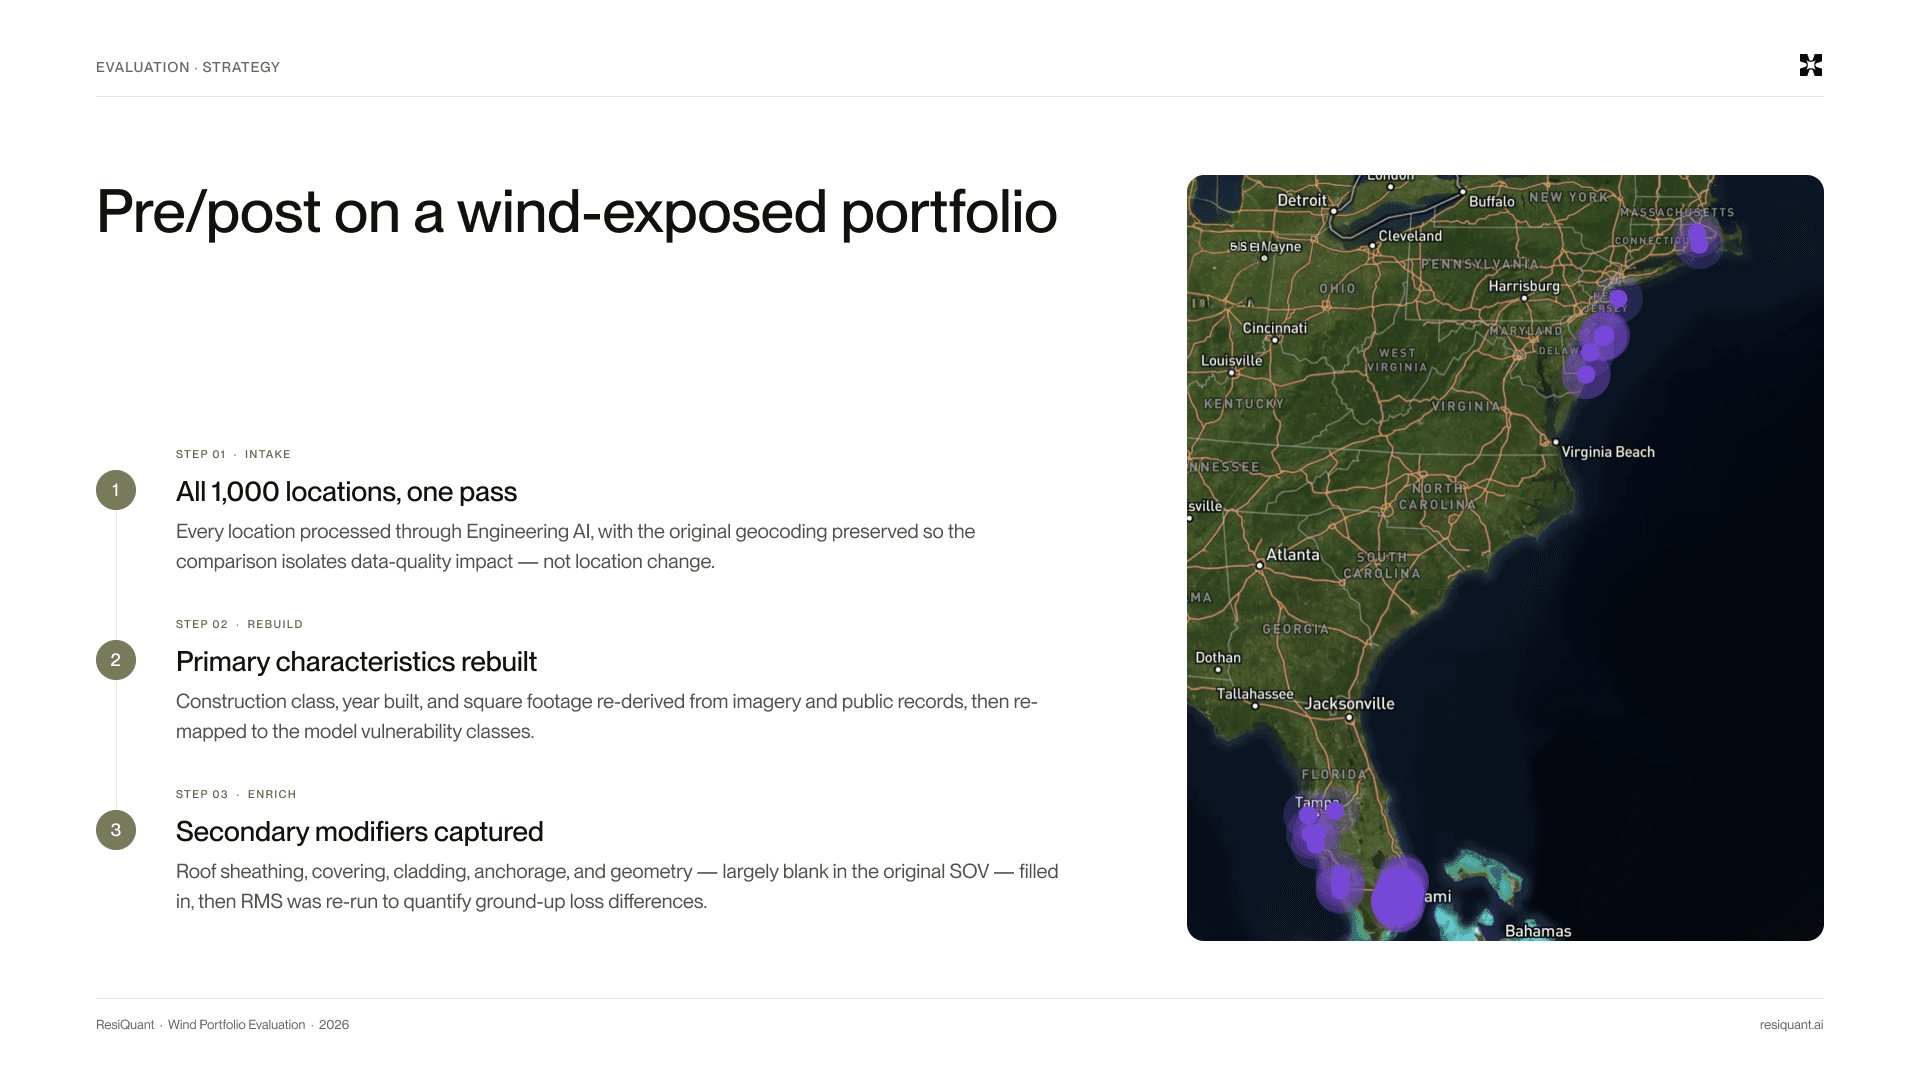
That creates a measurement problem. Move both variables and the loss number changes without telling you which one did the work. So for this study we froze the location. A real wind-exposed commercial book of 1,000 locations and $8.2 billion in total insured value ran through Engineering AI with every coordinate exactly as submitted. Only the building data changed.
The result was not one number
Modeled loss moved up on 596 locations and down on 404. Gross movement in both directions adds up to 49% of the book's original average annual loss. Only one in ten locations landed within 5% of where the submission had put them. Incorrect submissions in either direction costs money. Where the model overstated the loss, the carrier is holding capacity against risk that is not there, and that capacity could be binding other business. Where it understated the loss, the carrier is holding risk it priced as something milder, which makes those locations the clearest candidates for a change in terms at renewal.
Which direction matters more depends on the cycle. In a hard market it is the reinsurance conversation, where showing a ceding company that your exposure is better understood than the submission implies is worth real basis points. In a soft market it is a question of where to be aggressive. When everyone is cutting rate, the durable advantage is knowing which accounts are worth chasing and which to let a competitor have.

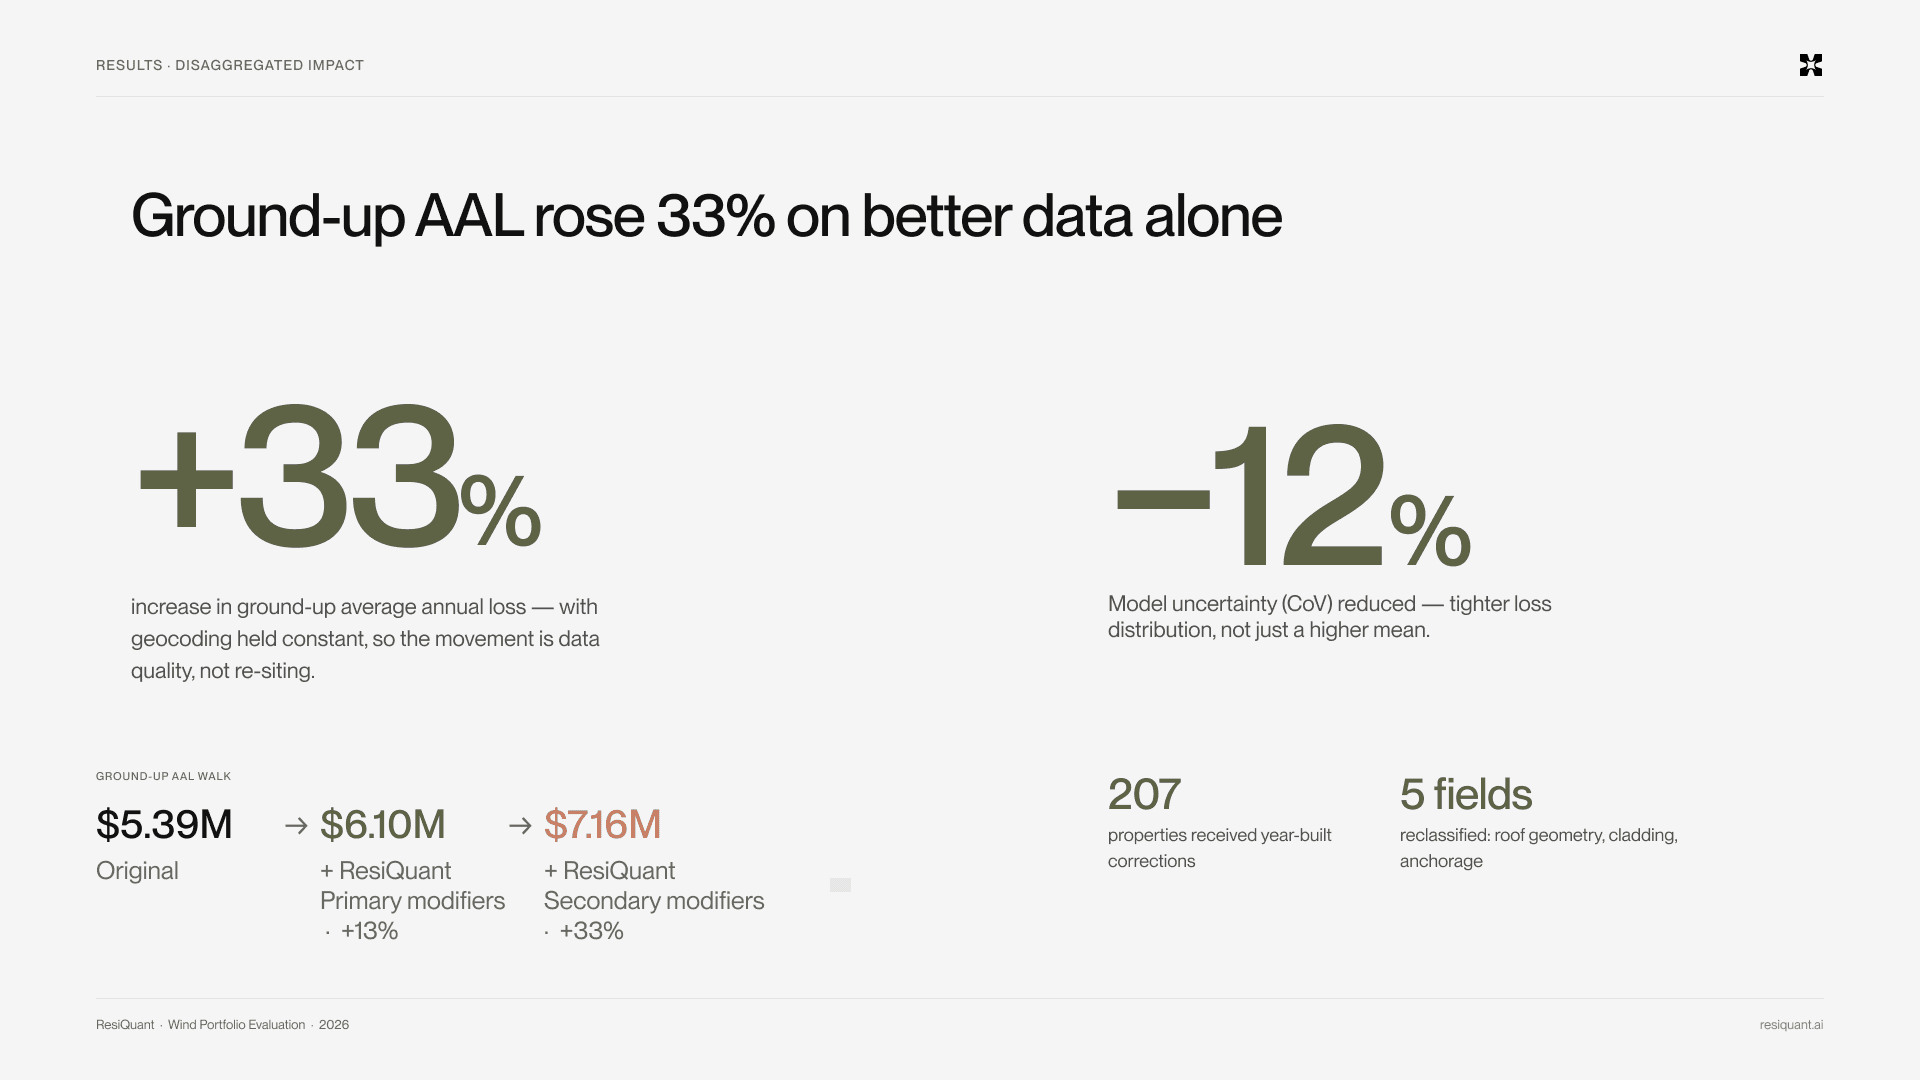
Netted out, ground-up average annual loss rose 13% on corrections to the characteristics the submission already carried, and 33% once blank fields were populated as well.
To be clear, this is just one book. How far another book moves, and in which direction, depends on what its submission happened to contain, and that varies from book to book. What transfers is the dispersion, the reason behind it, and what an underwriter can do with it.
What the schedule of values actually contained
The submitted SOV was not deficient by the standards of the market. It carried an address, a construction code, a year built, a story count, and a floor area for every location. The problem is what those fields are designed for.
Construction was coded under the ISO fire-rating scheme, which exists to determine combustibility. It sorts buildings by how they behave in a fire, which is a legitimate purpose and the reason those codes appear on nearly every commercial submission in the market. It is not built to answer how a building behaves under sustained lateral wind pressure and uplift. Those are different physics and they need a different taxonomy.
There is a practical reason the coarse scheme persists. A wind model offers a much larger set of construction classes, and choosing correctly between them is a structural engineering judgment rather than an underwriting one.
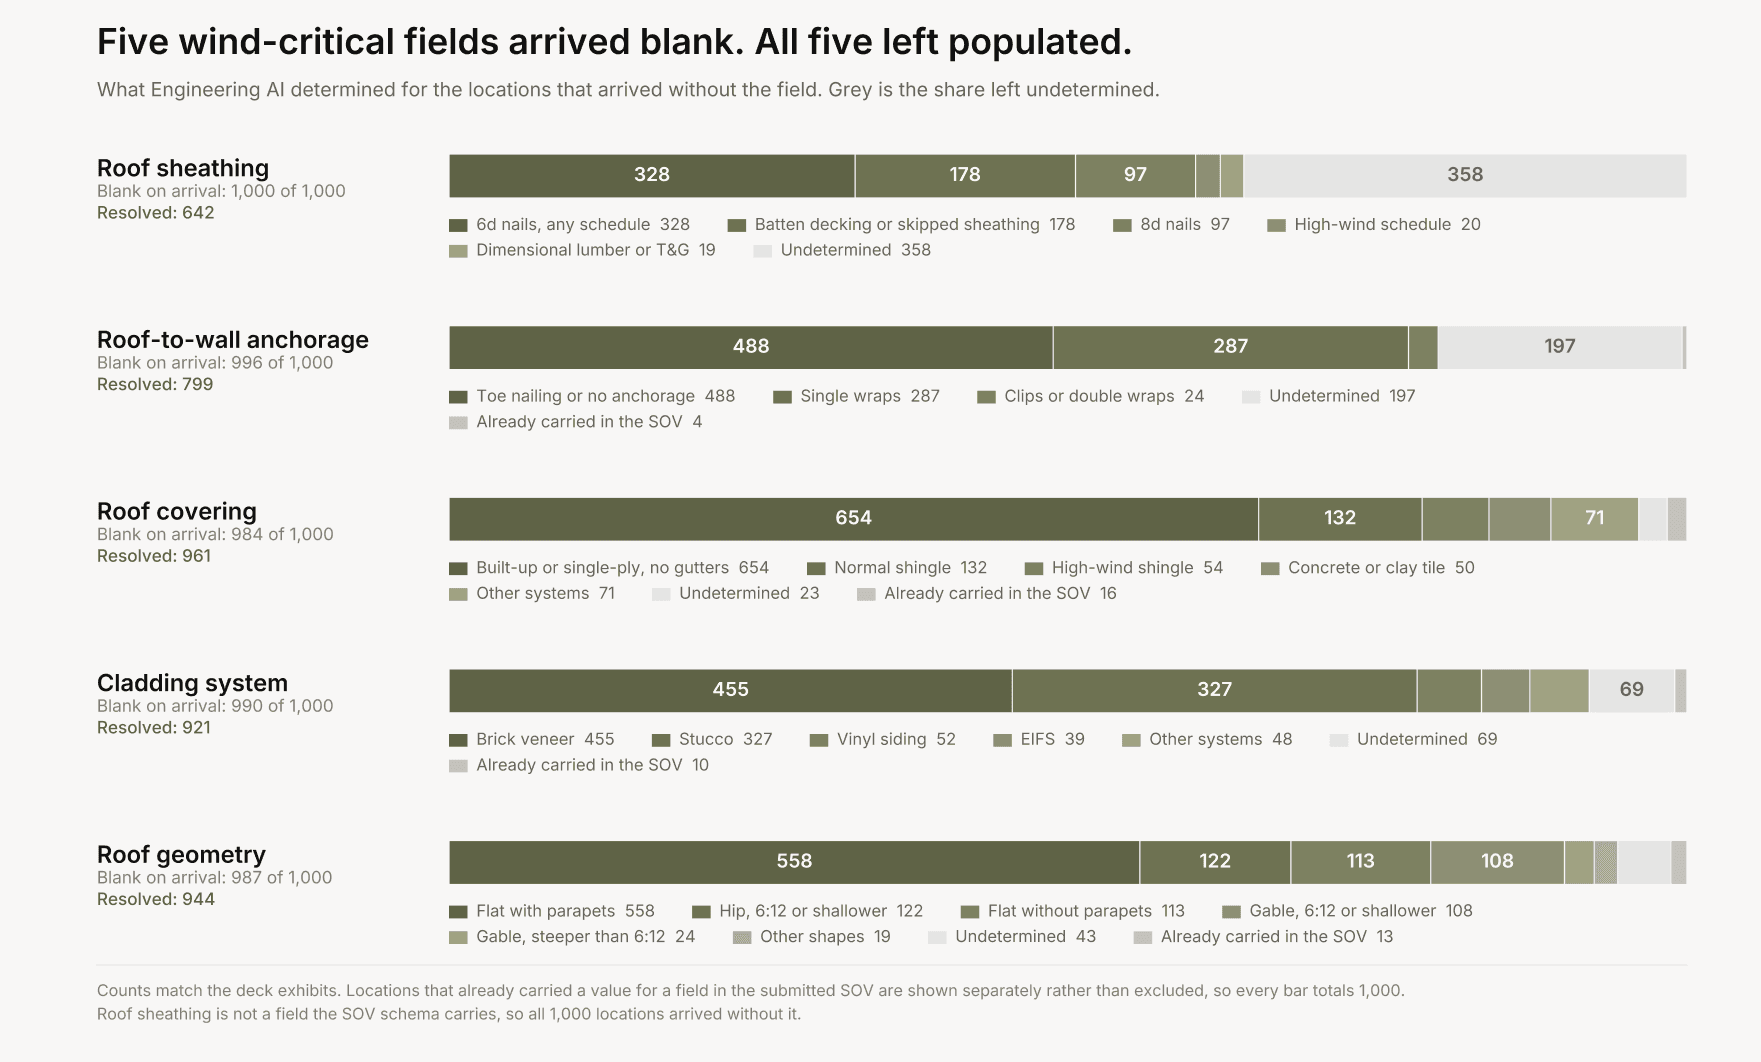
Then there were the fields that carried no information at all. Roof sheathing, roof covering, roof geometry, roof-to-wall anchorage, and cladding system arrived blank across the book. In a wind model these are not refinements. Roof covering and anchorage sit close to the center of how a hurricane actually destroys a commercial building, and a model asked to run without them falls back on regional averages.
Primary characteristics
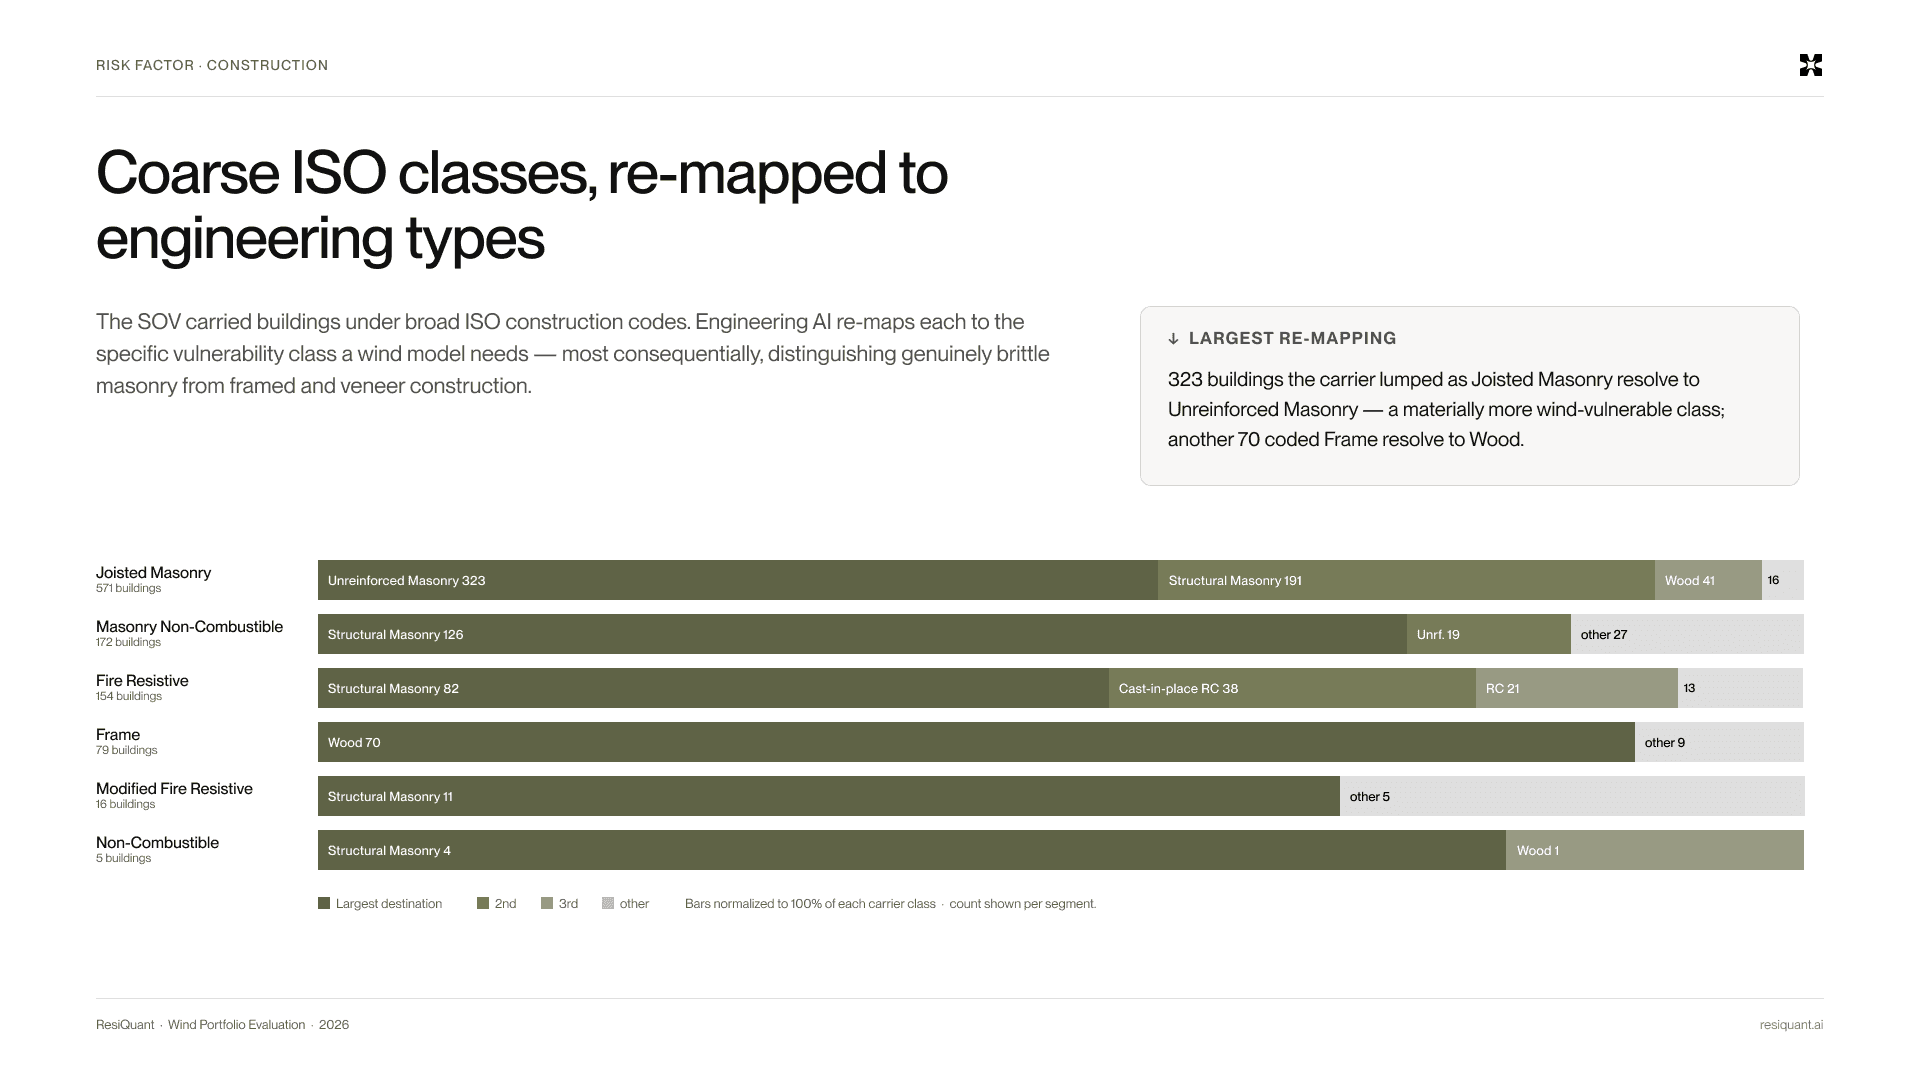
Re-mapping the construction codes was the first pass, and it turned out to be the largest driver of movement in both directions.
571 buildings arrived coded as Joisted Masonry. Reclassifying that one submitted class produced 40% of every dollar of downward movement on the book. The same class also produced increases, and more of them, so Joisted Masonry nets out slightly up. But no other field accounts for as much downward movement.
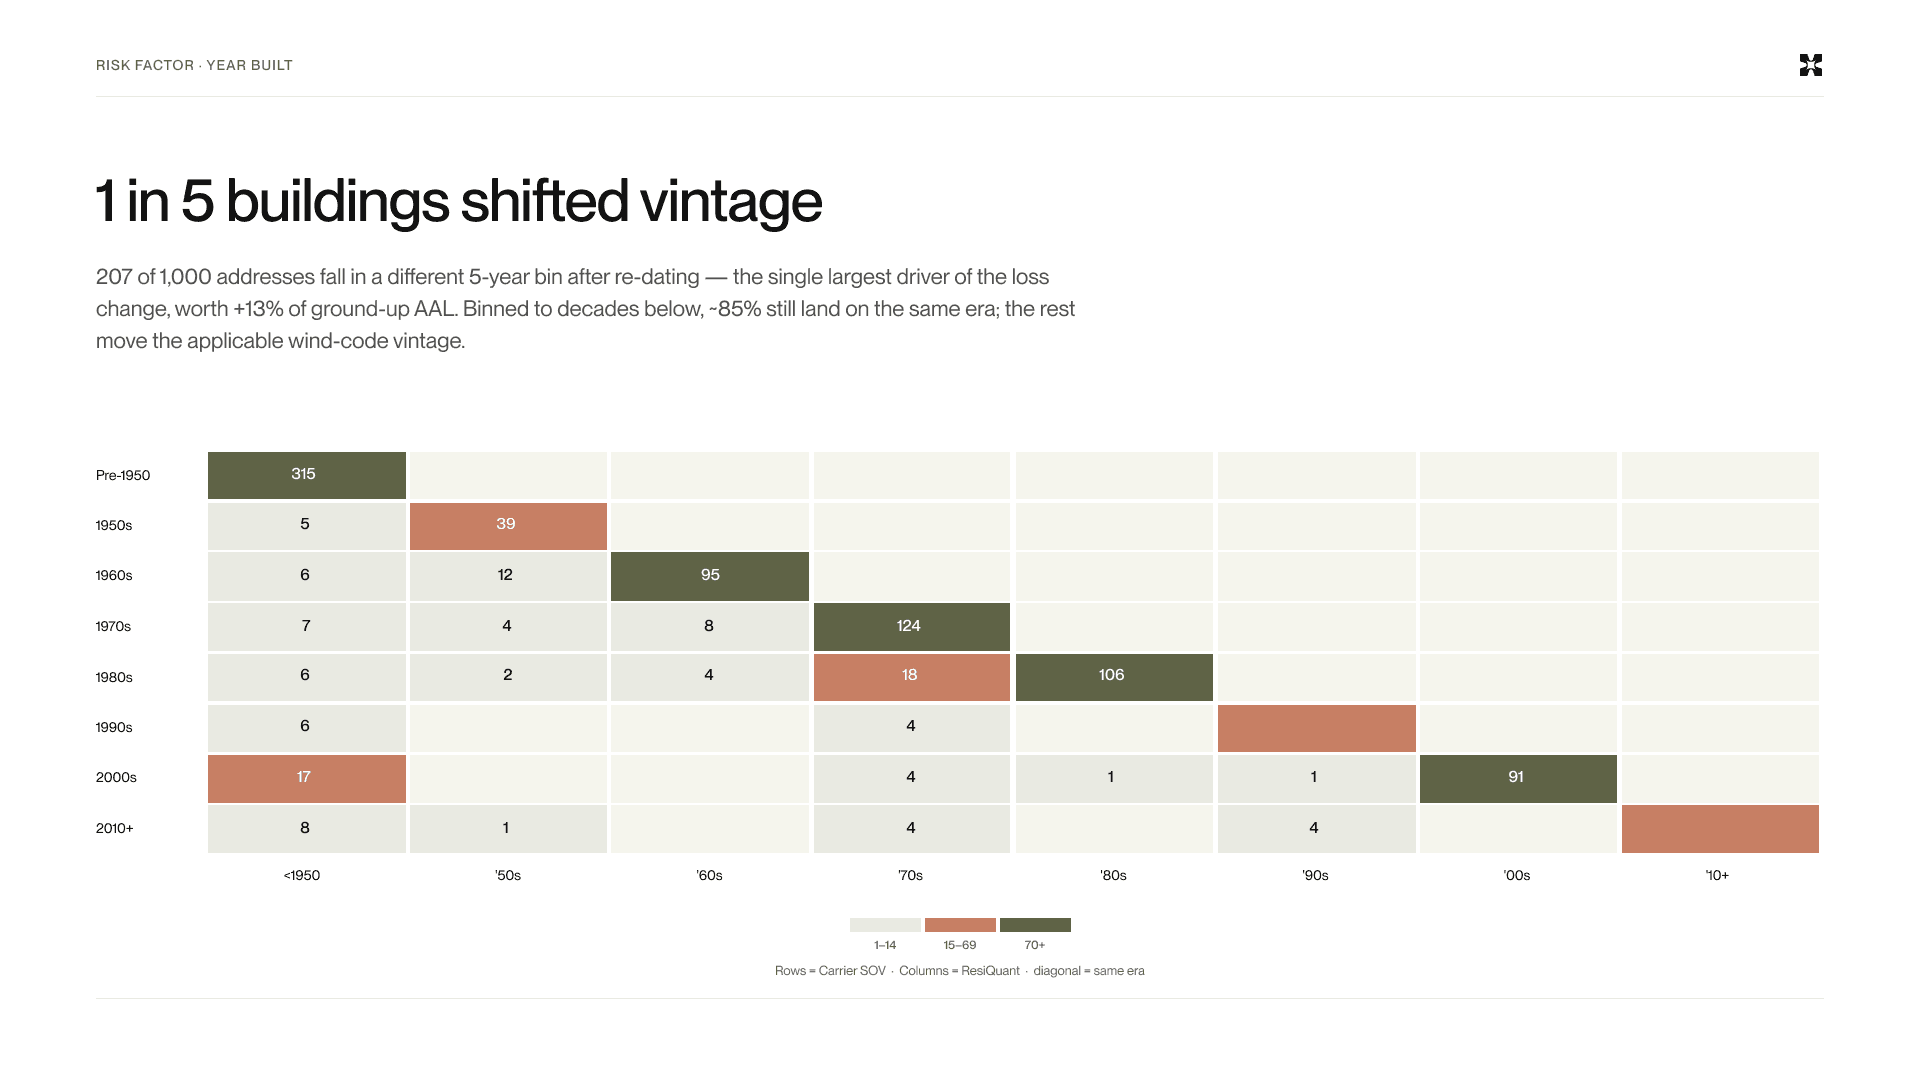
Year built moved next, and it moved in one direction. 207 of the 1,000 buildings fall into a different five-year bin after re-dating, and every one of those corrections made the building older. 168 move by a decade or more, 95 by twenty-five years or more.
A one-directional error is more interesting than a large one. Random noise would scatter both ways and largely cancel. A correction set that only ever ages the building points at something systematic, which is that the vintage on a submission tends to reflect the most recent substantial renovation rather than original construction. For fire rating that is often the relevant date. For wind it is the wrong one, because what matters is the code cycle the structural system was built to. A 2004 re-roof does not bring a 1927 building up to a 2004 wind standard. The 206 re-dated buildings account for 21% of all upward movement on the book. The effect scales with the size of the correction. The 94 buildings aged by twenty-five years or more, 9% of the locations, produced 10% of the increase on their own.
Secondary modifiers
Five fields arrived blank and were enriched with Engineering AI. Most portfolios have never have them filled in at all..
Roof sheathing resolved for 642 buildings and the distribution skews old and light. 328 resolve to 6d nailing at any schedule and 178 to batten decking or skipped sheathing, against only 20 at a modern high-wind schedule. Anchorage is starker still. 488 buildings resolve to toe nailing or no anchorage at all and 287 to single wraps, with clips on 23 and double wraps on one. That is the single connection deciding whether the roof separates from the walls under uplift.
The rest resolved across nearly the whole book. Roof covering came back dominated by built-up and single-ply membrane at 654 locations. Cladding came back brittle, 455 in brick veneer and 327 in stucco, both of which generate wind-borne debris as they fail. Geometry resolved to 558 flat roofs with parapets and a tail of 132 gables, which are the uplift-prone case.
Same code, opposite answers
The dispersion has a mechanism, and it is legible on a single field.
Take the buildings that arrived coded as Joisted Masonry. 237 of them resolved into one wind vulnerability class, and 79% of those went down, a median of 13%. Another 216 resolved into a different class, and 80% of those went up, a median of 35%.
Same code on the submission. Opposite answers underneath it.
Brick veneer presents as masonry from the street. A single wythe hung on a wood-framed wall looks the same as a load-bearing wall in a photograph or a site inspection summary, and a fire-rating scheme doesn’t have a reason to separate them, because in a fire the veneer and the structural wall behave more alike than not.
Under wind they are not alike at all. A veneered wood-frame wall resists lateral load through its stud framing and sheathing. A load-bearing masonry wall resists it through the masonry, and when it fails it fails in out-of-plane bending. Coding the first as the second assigns a building the strength and the failure mode of a structure it does not resemble. Reinforcement compounds it, since reinforced and unreinforced masonry are hard to separate without direct evidence of the steel.
Why a smaller spread matters more than a smaller average
The same run tightened the model's uncertainty. Coefficient of variation fell 12%.
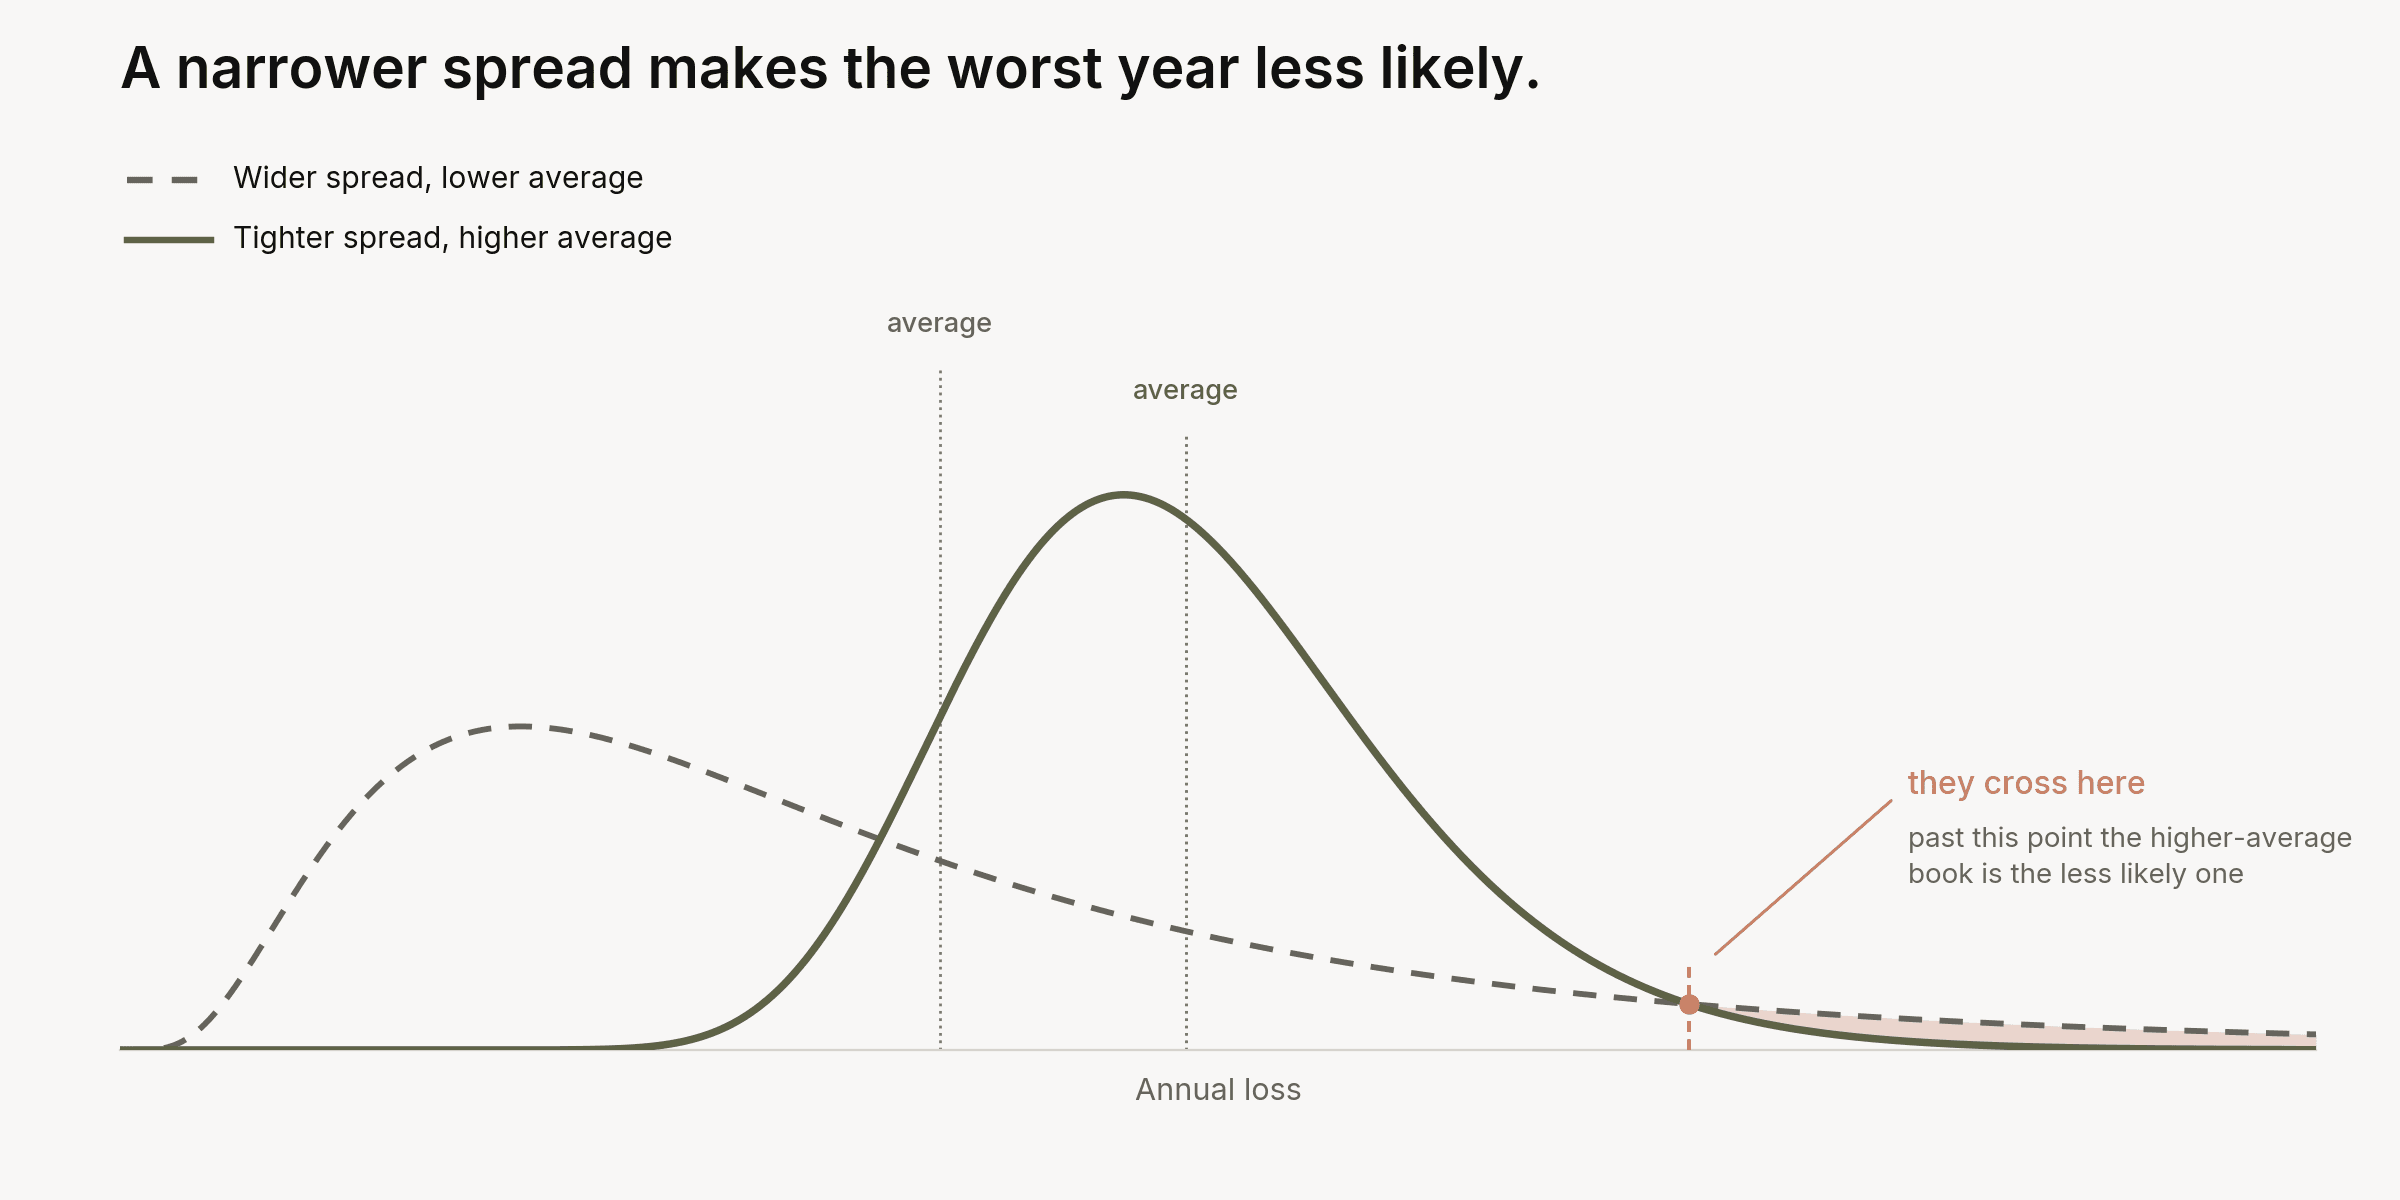
Coefficient of variation is the spread of the possible outcomes divided by the average of them. A catastrophe model does not produce one loss for a building. It simulates thousands of years and produces a distribution, and average annual loss is just a central tendency metric. The spread is how far the bad years sit from that center.
Nobody holds capital for the average year. What impacts a carrier is the year the big one arrives. So the width of the distribution governs how much capital has to sit behind the book, and a wide distribution is expensive whether or not the average is high.
That is why a higher average is not automatically worse news. Push the average up and pull the spread in far enough and the chance of an extreme year falls, even though the expected year costs more.
What the study does not measure
Everything above is average annual loss at the building. That is the right unit for asking whether a submission described a building correctly. It is not, on its own, enough to say whether a building belongs in a portfolio.
A carrier with a thousand locations on the Atlantic coast and one bad unreinforced masonry building in California is not meaningfully exposed to the California building. A single coastal event would cost more than losing it outright. Concentration and diversification decide portfolio risk, and nothing here touches them. So a location that moved up is not automatically a location to decline. It is a location that was described wrongly, and what to do about it depends on the rest of the book.
What this changes about selection
Ground-up average annual loss is not premium, and the figure nets movement in both directions rather than describing a uniform uplift.
What the study establishes is narrower and more useful. On a book where the coordinates were already correct, the addresses were clean, and the submission carried every standard field, half the modeled loss was sitting on the wrong buildings. Some of that was exposure nobody had priced. Some was margin nobody knew they had.
The second half is where the competitive asymmetry sits. On the 404 locations that moved down, the modeled loss is lower than the market believes, because every other carrier looking at that submission is reading the same coarse construction code. That is a list of accounts you can chase harder than anyone else can justify.
The locations that moved up split into two decisions. On renewal business they are candidates for a harder look. On new submissions they tell you which risks are worth competing for and which to let go, before the quote rather than after the loss.